The Canadian Solar Payback 2026, Canadian solar payback in 2026, varies widely across provinces due to differences in electricity pricing, incentives, and sunlight exposure.

While most homeowners recover installation costs within 6 to 12 years, evolving factors such as battery storage, rate structures, and policy changes are increasingly shaping real-world returns.
Canadian Solar Payback 2026
| Key Factor | Impact on Payback | Context |
|---|---|---|
| Electricity Rates | Higher rates = faster ROI | Alberta, Ontario |
| Incentives | Reduce upfront cost | Federal + provincial |
| Net Metering | Faster cost recovery | Strong in Ontario |
| Battery Storage | Extends independence but adds cost | Growing trend |
| Rate Structure | Time-of-use boosts savings | Urban provinces |
The Canadian Solar Payback 2026, Canadian solar payback in 2026, is shaped by regional economics, policy frameworks, and evolving technology.
While some provinces offer rapid financial returns, others require longer-term investment strategies.As energy prices rise and solar costs decline, the financial case for solar is expected to strengthen across Canada.
Canadian Solar Payback 2026: Why Solar Payback Differs Across Canada
The Canadian Solar Payback 2026, Canadian solar payback, depends on a combination of economic, regulatory, and environmental variables. Experts note that sunlight alone is not the decisive factor. Instead, electricity pricing and policy frameworks play a larger role.
Provinces with higher energy costs allow homeowners to offset more expensive electricity, accelerating returns. Most systems in Canada achieve payback within 8–12 years, though this varies significantly by province.
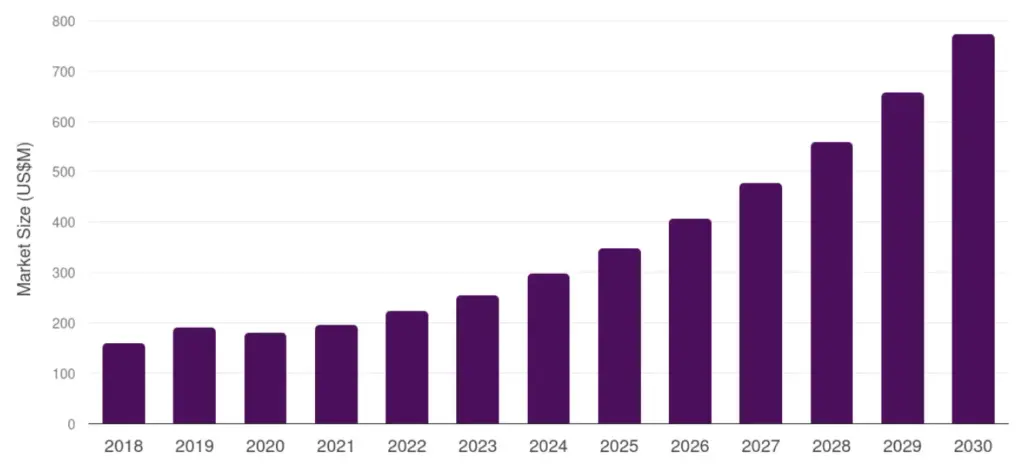
National Overview: Costs and Returns
Typical solar economics in Canada (2026):
- System cost: $15,000–$35,000
- Annual savings: $900–$3,000
- Lifespan: 25–30 years
This means solar systems can generate 15–20 years of net financial benefit after payback, making them long-term income-generating assets.
Province-by-Province Solar Payback (2026)
Alberta: Fastest Payback (5–10 Years)
- High electricity prices.
- Strong solar irradiance.
- Competitive incentive programs.
Alberta offers the most favorable conditions for solar ROI in Canada.
Ontario: Stable Returns (8–12 Years)
- Time-of-use electricity pricing.
- Strong net metering.
- Rising energy costs.
Solar offsets expensive peak-hour electricity, improving savings.
British Columbia: Slower Payback (15–20 Years)
- Low-cost hydroelectric power.
- Limited savings potential.
Solar remains viable but requires a longer-term investment horizon.
Quebec & Manitoba: Long Payback
- Very low electricity prices.
- Limited financial incentive.
Payback often exceeds 12–15 years.
Atlantic Provinces: Strong Potential
- Higher electricity costs.
- Growing incentive programs.
These provinces offer improving solar economics.
Utility Pricing Models: A Hidden Factor
Time-of-Use vs Flat Rates
- Time-of-use pricing increases solar savings during peak hours.
- Flat-rate pricing reduces financial advantage.
Ontario benefits significantly from time-of-use structures, enhancing ROI.
Battery Storage: Does It Improve Payback?
Cost vs Benefit
Battery systems:
- Increase upfront cost by $8,000–$15,000.
- Provide backup power and energy independence.
Financial Impact
- Often extend payback period.
- Reduce reliance on grid electricity.
Experts note that batteries are currently more about resilience than financial return.
Degradation and Maintenance Costs
Solar panels degrade over time:
- Efficiency drops by ~0.5% annually.
- Systems retain ~85–90% output after 25 years.
Maintenance costs remain low but include:
- Occasional inverter replacement.
- Cleaning and inspection.
These factors slightly affect long-term ROI but do not significantly alter payback timelines.
Net Metering vs Energy Independence
Net Metering Model
- Sell excess energy to grid.
- Faster financial returns.
Self-Consumption Model
- Use stored energy.
- Lower grid dependence.
Financially, net metering remains more advantageous in most provinces.
Becoming an energy superpower starts with how we power Canadian homes, businesses, and cities.⁰⁰That’s why today I announced $13M to help modernize Ontario’s electricity grid by driving clean energy integration and transmission efficiency — and to make it possible for Ontarians… pic.twitter.com/aNhzmWpVWe
— Tim Hodgson (@timhodgsonmt) August 15, 2025

Break-Even Timeline and Investment Returns
Phase 1: Recovery (0–10 Years)
- System offsets electricity bills.
- Investment gradually recovered.
Phase 2: Profit (10–30 Years)
- Electricity costs near zero.
- Savings accumulate.
Solar systems can deliver 6–12% annual return, comparable to traditional investments.
Inflation and Energy Price Trends
Electricity prices are expected to rise due to:
- Infrastructure costs.
- Energy demand growth.
- Transition to renewable energy.
Solar provides a hedge against these increases, locking in energy costs.
Rental and Landlord Considerations
Solar adoption in rental properties is growing but faces challenges:
- Split incentives between landlord and tenant.
- Limited access to subsidies.
Innovative leasing models are emerging to address this gap.
Consumer Decision Checklist
Before installing solar, homeowners should evaluate:
- Local electricity rates.
- Available incentives.
- Roof orientation and sunlight exposure.
- Financing options.
- Expected length of home ownership.
This checklist helps ensure optimal financial outcomes.
Risks and Limitations
Policy Risk
Changes in incentives or net metering can impact returns.
Regional Inequality
Solar profitability varies significantly by province.
Upfront Cost
Initial investment remains a barrier for some households.
Real-World Case Scenarios
Alberta Household
- Payback: ~6 years.
- High savings.
- Strong ROI.
Ontario Household
- Payback: ~10 years.
- Moderate savings.
British Columbia Household
- Payback: ~18 years.
- Long-term investment.
Expert Perspectives
Energy analysts emphasize that solar is increasingly viewed as a financial asset. One expert stated that “solar provides predictable, inflation-protected returns, making it comparable to low-risk investments.”
Related Links
Australia’s New Solar Recycling Mandate: How Panel Disposal Fees Affect You
Canada’s ‘Sun-Tax’ Debate: Are Utilities About to Charge You for Exporting Solar?
Future Outlook
Solar payback periods are expected to improve due to:
- Falling equipment costs.
- Rising electricity prices.
- Advances in energy storage.
Experts predict solar will become financially viable across all provinces within the next decade.
FAQs
How long does solar take to pay off?
Typically 6–12 years depending on province.
Which province has the fastest payback?
Alberta offers the fastest returns.
Are batteries worth it financially?
Currently, they extend payback but improve energy independence.
Does solar increase home value?
Yes, often by $15,000–$25,000.